WP 12: Management
General Information
To develop and sustain technical coordination and project management to successfully complete all aspects of the
proposal, in accordance with the EC grant agreement and consortium agreement:
- To manage all operational tasks during the project;
- To manage all internal communication tasks within the project.
Latest Publication

Methods and Explanation
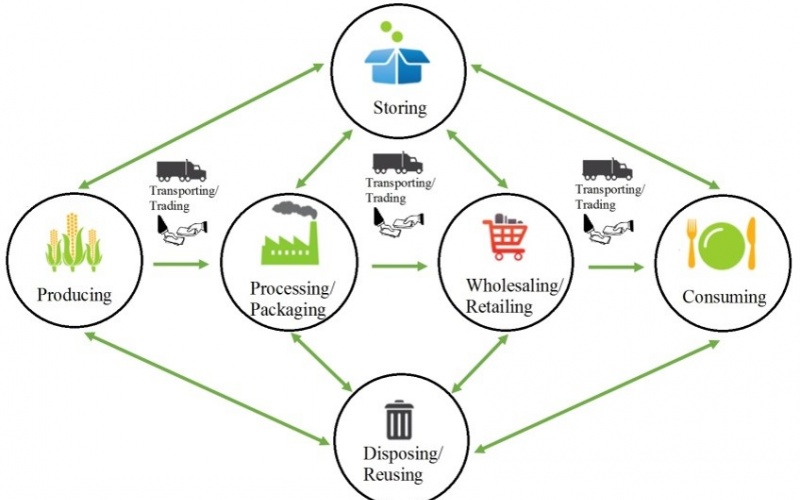
From raw data to performance metrics Goal of this document is to give a short introduction into the SUSFANS-visualizer: what does it show (section 2) and how is the data constructed (chapter 3). It is also an enclosed descriptive document for the available data (aggregated variables and performance metrics) on the SUSFANS website. The development of the SUSFANS-visualizer is part of the SUSFANS-project having the overall objective to build the conceptual framework, the evidenced base and analytical tools for underpinning EU-wide food policies with respect to their impact on consumer diets and their implications for nutrition and public health in the EU, the environment, the competitiveness of the EU agri-food sectors, and global food and nutrition security. The visualizer is available on https://www.susfans.eu/susfans-visualizer (figure 1).
Take a lookWeb Visualizer data (ZIP)
Data of the SUSFANS Visualizer.
Take a lookWeb Visualizer data (XLSX)
Visualizer Data as Part of WP 12.3
Take a lookWeb data behind the visualizer (XLSX)
The Web data behind the Visualizer (Code)
Take a lookNews in work package 12


Research Data WP 12
| Title | filetype | Download |
|---|---|---|
| Methods and Explanation | Link | |
| Web Visualizer data (ZIP) | zip (compressed Container) | Link |
| Web Visualizer data (XLSX) | xls (EXCEL) | Link |
| Web data behind the visualizer (XLSX) | xls (EXCEL) | Link |
Work package leader


Work package member


© Copyright 2015. METRICS, MODELS AND FORESIGHT FOR EUROPEAN SUSTAINABLE FOOD AND NUTRITION SECURITY - SUSFANS
H2020-SFS-2014-2,
Grant 633692